wide vector3 dot/glam_f32x1
Violin Plot

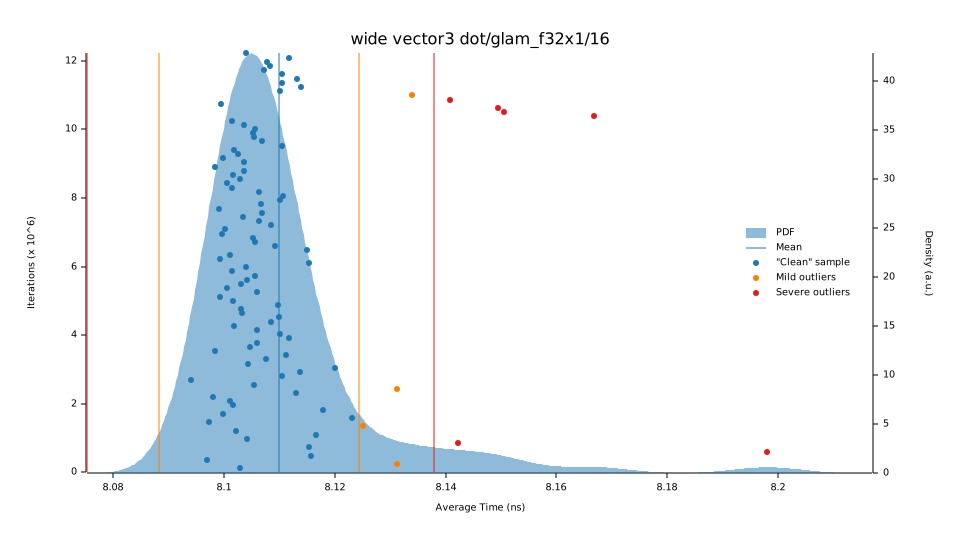
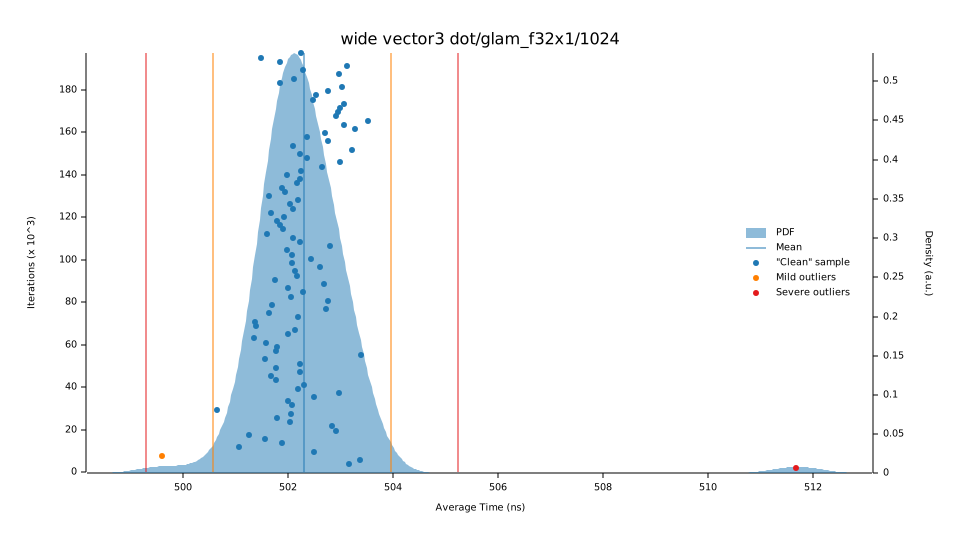
This chart shows the relationship between function/parameter and iteration time. The thickness of the shaded region indicates the probability that a measurement of the given function/parameter would take a particular length of time.
Line Chart

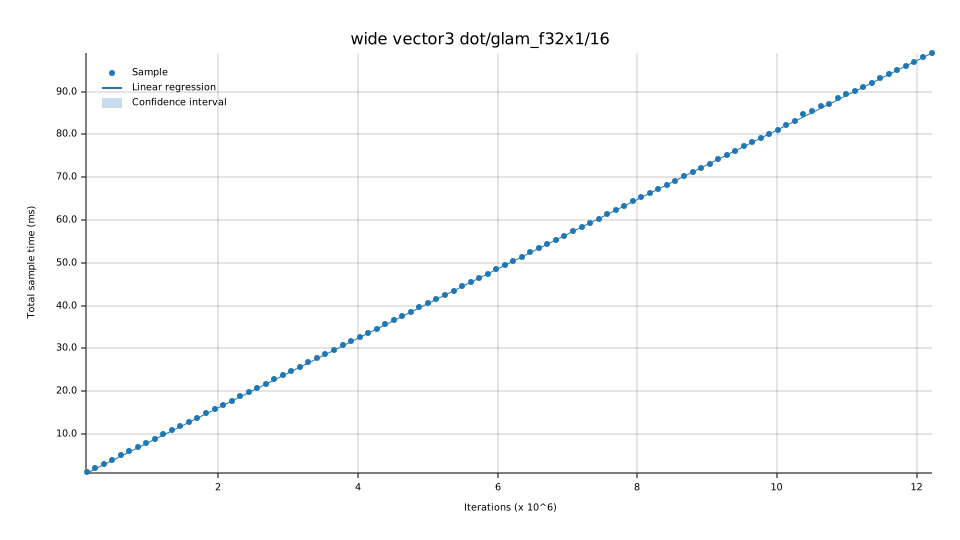
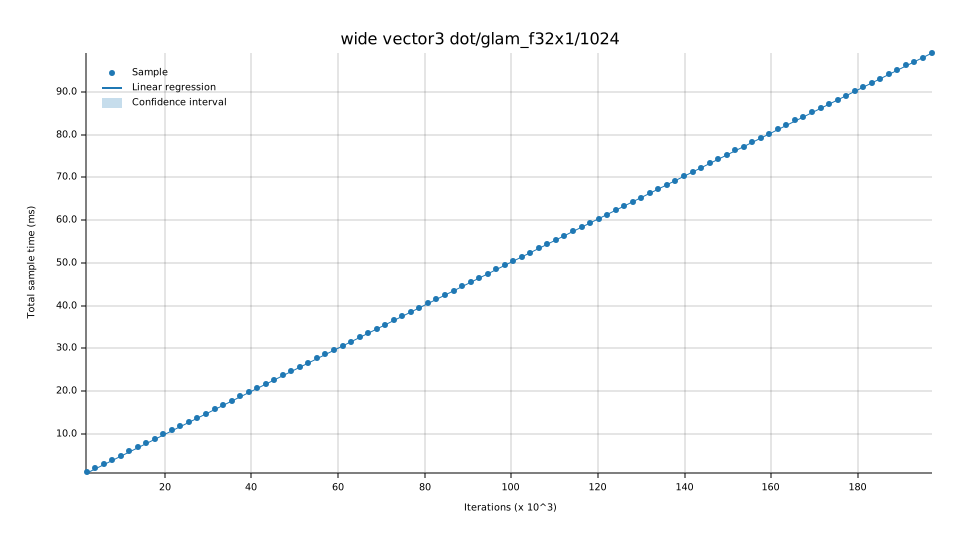
This chart shows the mean measured time for each function as the input (or the size of the input) increases.
Throughput Chart

This chart shows the mean measured throughput for each function as the input (or the size of the input) increases.
wide vector3 dot/glam_f32x1/16
|
|
wide vector3 dot/glam_f32x1/1024
|
|